Performance Indicator#
It is fundamental for any algorithm to measure its performance. In a multi-objective scenario, we can not calculate the distance to the true global optimum but must consider a set of solutions. Moreover, sometimes the optimum is not even known, and other techniques must be used.
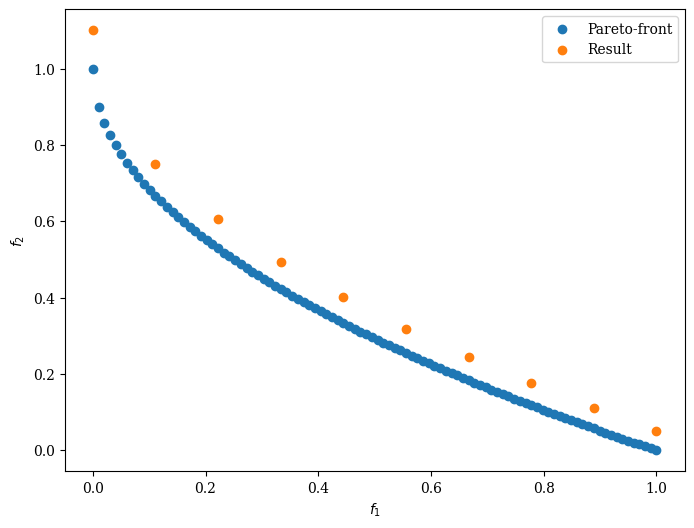
First, let us consider a scenario where the Pareto-front is known:
[1]:
import numpy as np
from pymoo.problems import get_problem
from pymoo.visualization.scatter import Scatter

# The pareto front of a scaled zdt1 problem
pf = get_problem("zdt1").pareto_front()

# The result found by an algorithm
A = pf[::10] * 1.1

# plot the result
Scatter(legend=True).add(pf, label="Pareto-front").add(A, label="Result").show()
[1]:
<pymoo.visualization.scatter.Scatter at 0x1077e1900>

Generational Distance (GD)#
The GD performance indicator [47] measures the distance from solution to the Pareto-front. Let us assume the points found by our algorithm are the objective vector set \(A=\{a_1, a_2, \ldots, a_{|A|}\}\) and the reference points set (Pareto-front) is \(Z=\{z_1, z_2, \ldots, z_{|Z|}\}\). Then,
\begin{align} \begin{split} \text{GD}(A) & = & \; \frac{1}{|A|} \; \bigg( \sum_{i=1}^{|A|} d_i^p \bigg)^{1/p}\\[2mm] \end{split} \end{align}
where \(d_i\) represents the Euclidean distance (p=2) from \(a_i\) to its nearest reference point in \(Z\). Basically, this results in the average distance from any point \(A\) to the closest point in the Pareto-front.
[2]:
from pymoo.indicators.gd import GD

ind = GD(pf)
print("GD", ind(A))
GD 0.05497689467314528
Generational Distance Plus (GD+)#
Ishibushi et al. proposed in [48] GD+:
\begin{align} \begin{split} \text{GD}^+(A) & = & \; \frac{1}{|A|} \; \bigg( \sum_{i=1}^{|A|} {d_i^{+}}^2 \bigg)^{1/2}\\[2mm] \end{split} \end{align}
where for minimization \(d_i^{+} = \max \{ a_i - z_i, 0\}\) represents the modified distance from \(a_i\) to its nearest reference point in \(Z\) with the corresponding value \(z_i\).
[3]:
from pymoo.indicators.gd_plus import GDPlus

ind = GDPlus(pf)
print("GD+", ind(A))
GD+ 0.05497689467314528
Inverted Generational Distance (IGD)#
The IGD performance indicator [49] inverts the generational distance and measures the distance from any point in \(Z\) to the closest point in \(A\).
\begin{align} \begin{split} \text{IGD}(A) & = & \; \frac{1}{|Z|} \; \bigg( \sum_{i=1}^{|Z|} \hat{d_i}^p \bigg)^{1/p}\\[2mm] \end{split} \end{align}
where \(\hat{d_i}\) represents the euclidean distance (p=2) from \(z_i\) to its nearest reference point in \(A\).
[4]:
from pymoo.indicators.igd import IGD

ind = IGD(pf)
print("IGD", ind(A))
IGD 0.06690908300327662
Inverted Generational Distance Plus (IGD+)#
In [48] Ishibushi et al. proposed IGD+ which is weakly Pareto compliant whereas the original IGD is not.
\begin{align} \begin{split} \text{IGD}^{+}(A) & = & \; \frac{1}{|Z|} \; \bigg( \sum_{i=1}^{|Z|} {d_i^{+}}^2 \bigg)^{1/2}\\[2mm] \end{split} \end{align}
where for minimization \(d_i^{+} = \max \{ a_i - z_i, 0\}\) represents the modified distance from \(z_i\) to the closest solution in \(A\) with the corresponding value \(a_i\).
[5]:
from pymoo.indicators.igd_plus import IGDPlus

ind = IGDPlus(pf)
print("IGD+", ind(A))
IGD+ 0.06466828842775944
Hypervolume#
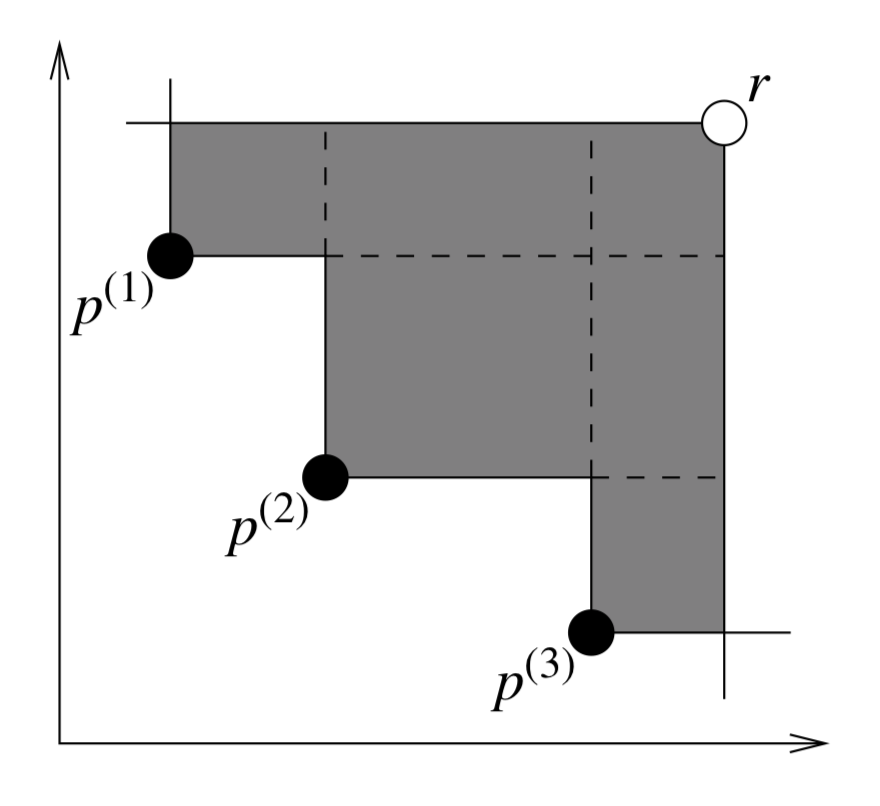
For all performance indicators shown so far, a target set needs to be known. For Hypervolume only a reference point needs to be provided. First, I would like to mention that we are using the Hypervolume implementation from moocore. It calculates the area/volume, which is dominated by the provided set of solutions with respect to a reference point.

This image is taken from [50] and illustrates a two objective example where the area which is dominated by a set of points is shown in grey. Whereas for the other metrics, the goal was to minimize the distance to the Pareto-front, here, we desire to maximize the performance metric.
[6]:
from pymoo.indicators.hv import HV

ref_point = np.array([1.2, 1.2])

ind = HV(ref_point=ref_point)
print("HV", ind(A))
HV 0.9631646448182305