
Star Coordinate Plot#
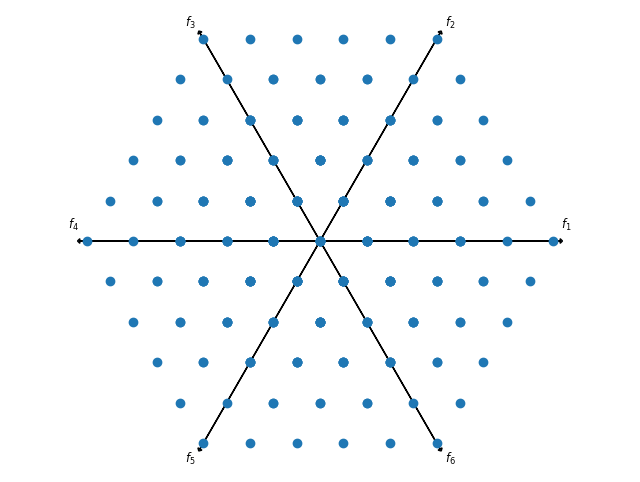
A Star Coordinate Plot maps a higher dimensional space with a non-linear function to two dimensions. Compared to Radviz, points can be outside of the circle.
Let us visualize some test data:
[1]:
from pymoo.problems import get_problem
from pymoo.util.ref_dirs import get_reference_directions

ref_dirs = get_reference_directions("uniform", 6, n_partitions=5)
F = get_problem("dtlz1").pareto_front(ref_dirs)
A simple Star Coordinate Plot with points can be created by:
[2]:
from pymoo.visualization.star_coordinate import StarCoordinate

StarCoordinate().add(F).show()
[2]:
<pymoo.visualization.star_coordinate.StarCoordinate at 0x7476d838cc10>
[3]:
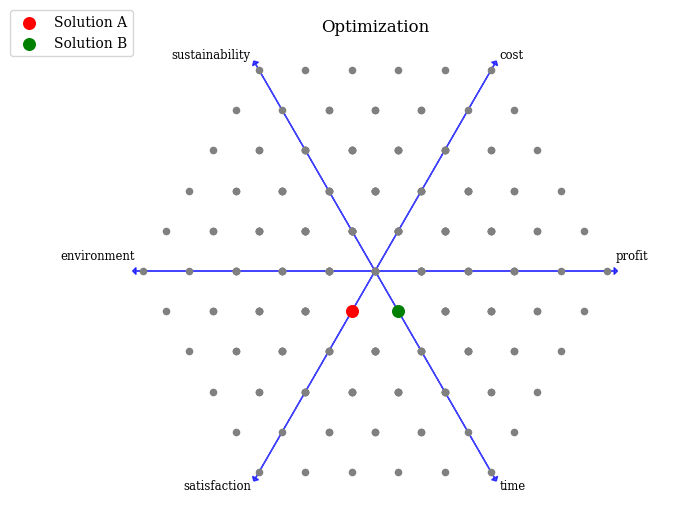
plot = StarCoordinate(title="Optimization",
                      legend=(True, {'loc': "upper left", 'bbox_to_anchor': (-0.1, 1.08, 0, 0)}),
                      labels=["profit", "cost", "sustainability", "environment", "satisfaction", "time"],
                      axis_style={"color": "blue", 'alpha': 0.7},
                      arrow_style={"head_length": 0.015, "head_width": 0.03})
plot.add(F, color="grey", s=20)
plot.add(F[65], color="red", s=70, label="Solution A")
plot.add(F[72], color="green", s=70, label="Solution B")
plot.show()
[3]:
<pymoo.visualization.star_coordinate.StarCoordinate at 0x7476d5ab2250>
API#
- class pymoo.visualization.star_coordinate.StarCoordinate(axis_extension: float = 1.03, **kwargs)[source]
Star coordinate plot visualization.
- Parameters:
axis_extension – Extension factor for the axes.
axis_style – {axis_style}
labels – {labels}
endpoint_style – Endpoints are drawn at each extreme point of an objective. This style can be modified.
figsize – {figsize}
title – {title}
legend – {legend}
tight_layout – {tight_layout}
cmap – {cmap}