
Scatter Plot#
The traditional scatter plot is mostly used for lower dimensional objective spaces.
Scatter 2D#
[1]:
from pymoo.visualization.scatter import Scatter
from pymoo.problems import get_problem

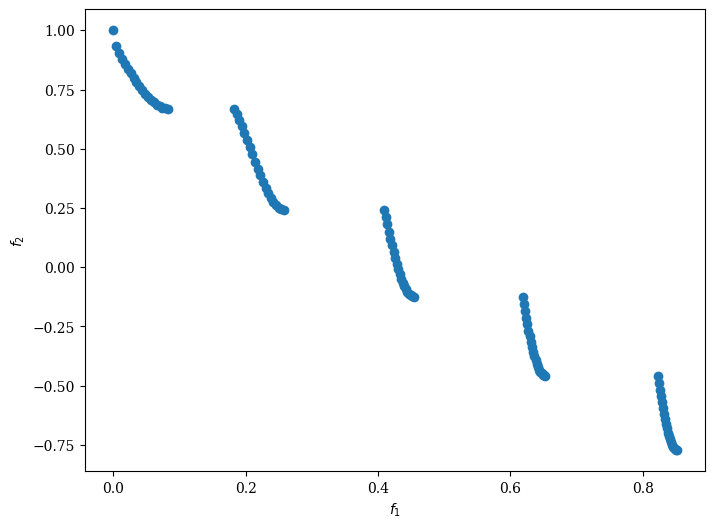
F = get_problem("zdt3").pareto_front()
Scatter().add(F).show()
[1]:
<pymoo.visualization.scatter.Scatter at 0x7df5e86a1490>
[2]:
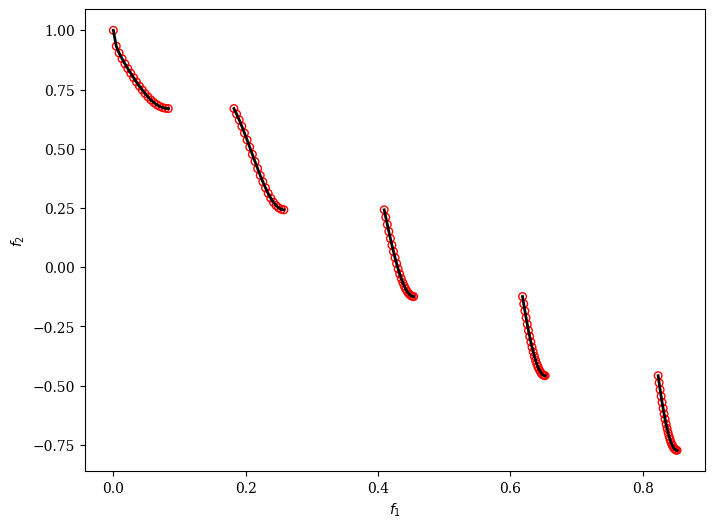
F = get_problem("zdt3").pareto_front(use_cache=False, flatten=False)
plot = Scatter()
plot.add(F, s=30, facecolors='none', edgecolors='r')
plot.add(F, plot_type="line", color="black", linewidth=2)
plot.show()
[2]:
<pymoo.visualization.scatter.Scatter at 0x7df62048bdd0>
Scatter 3D#
[3]:
from pymoo.util.ref_dirs import get_reference_directions

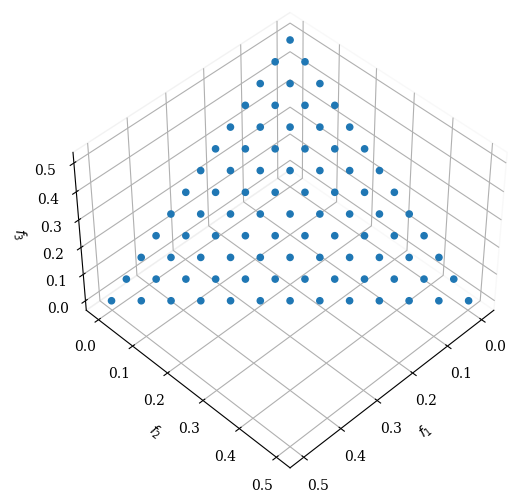
ref_dirs = get_reference_directions("uniform", 3, n_partitions=12)

F = get_problem("dtlz1").pareto_front(ref_dirs)

plot = Scatter()
plot.add(F)
plot.show()
[3]:
<pymoo.visualization.scatter.Scatter at 0x7df606c06e50>
Scatter ND / Pairwise Scatter Plots#
[4]:
import numpy as np
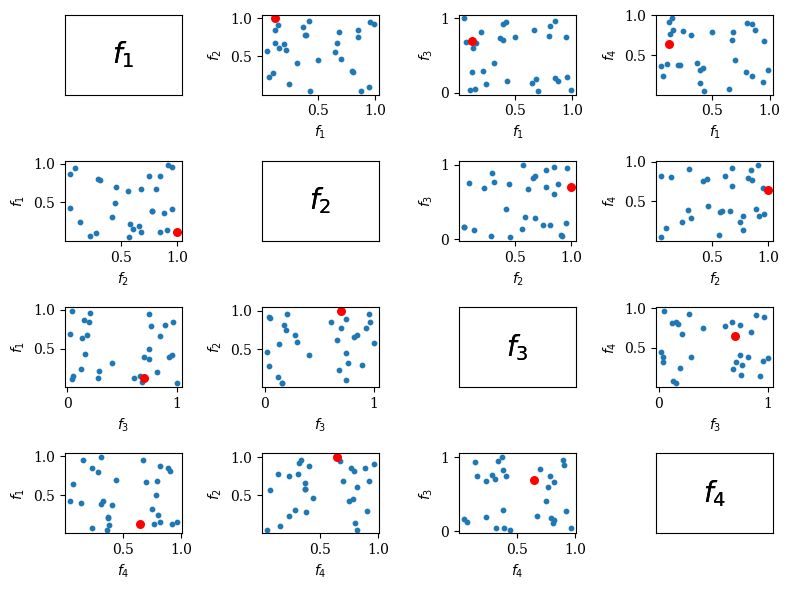
F = np.random.random((30, 4))

plot = Scatter(tight_layout=True)
plot.add(F, s=10)
plot.add(F[10], s=30, color="red")
plot.show()
[4]:
<pymoo.visualization.scatter.Scatter at 0x7df5dc4ff0d0>
API#
- class pymoo.visualization.scatter.Scatter(plot_3d: bool = True, angle: tuple[int, int] = (45, 45), **kwargs)[source]
Scatter plot visualization.
- Parameters:
plot_3d – Whether to plot 3D scatter plots.
angle – The viewing angle for 3D plots.
axis_style – {axis_style}
labels – {labels}
figsize – {figsize}
title – {title}
legend – {legend}
tight_layout – {tight_layout}